Least squares regression project.
STATS.
Least squares regression project.
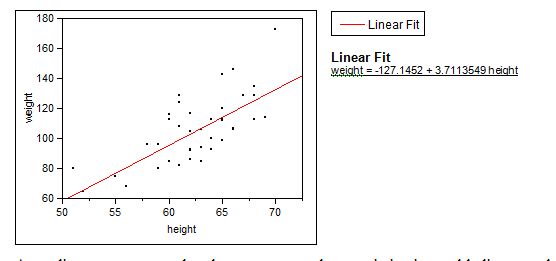
I think it would make most sense to predict weight from height, because the growth of height means more bones, more flesh. So as height increases, weight would normally increase along. But gaining weight simply means more fat stored to the body, and it has nothing to do with height. I expect the association between height and weight to be roughly linear and positive.
According to our scatter plot, there are curves, the association is roughly linear, and the regression line shows a positive relationship between height and weight. This scatter plot confirmed my expectations of the relationship between height and weight.
According to the linear model, we expect that for every extra inch increase in height, there will be about 3.711 pounds increase in weight on average. And the predictions say that when height equals to zero inch, the weight will be -127.14 pounds. This is extrapolation and does not have any meaning in this problem.
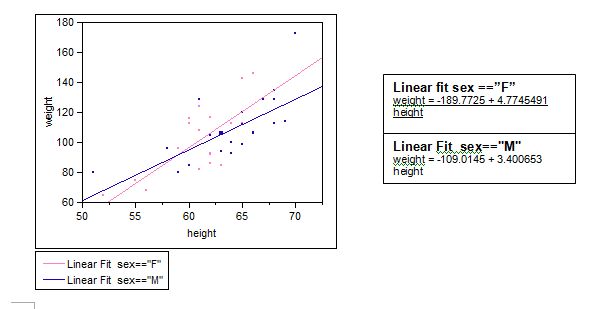
Yes these lines indicate a difference between the two groups. The slope of the regression line for female group of data is 4.7745 and for male group is 3.4, this means for the same number of inches increase in height, girls are likely to gain more weight than boys.
According to our linear model, we expect that for every extra inch increase in height, there will be about 3.4 pounds increase in weight for boys, and 4.77 pounds increase in weight for girls, on average.
Predictions according to the first equation (with out grouping by sex.)
shirley 17 F 67 122 121.515529
roberto 16 M 70 130 132.649594
charmaine 12 F 60 105 95.536045
huy 14 m 66 112 117.804174
Predictions according to the second & third equation (grouping by sex)
shirley 17 F 67 122 130.122244
roberto 16 M 70 130 129.03125
charmaine12 F 60 105 96.7004008
huy 14 M 66 112 115.428638
The residuals are generally small and the predictions are pretty accurate. Both ways of predicting result some errors, and I think neither is more accurate than the other. The differences between the groups that the lines convey are probably due to other factors like age, which we did not take into consideration, or by grouping the data by sex, we have weakened the association of weight and height.

